After Five Years on the Tracks: Missouri’s River Runner Studies Offer Concrete Data on State-Supported Rail Economics
Newly released 2026 Missouri Department of Transportation data shows total economic output along the St. Louis–Kansas City corridor climbed 133% over pre-pandemic baselines, driven by single-seat Chicago connectivity and a fivefold surge in local contractor spending.

October 21, 2026
Ryan Pecaut
What happens to a state budget, and local economies, once a state-supported passenger rail line is actually up and running?
A newly released July 2026 economic impact study from the Missouri Department of Transportation (MoDOT), recently highlighted in a comparative briefing by the regional advocacy coalition Northern Flyer Alliance (NFA), provides five years of longitudinal data from a peer Midwestern corridor.
Comparing MoDOT’s 2021 and 2026 economic impact evaluations of the Missouri River Runner—a 283-mile Amtrak corridor connecting St. Louis and Kansas City—reveals how changes in operating subsidies, capital procurement, and regional through-routing affect a state’s bottom line.
The Corridor at a Glance
Operating two daily round trips parallel to Interstate 70, the Missouri River Runner serves as an intercity spine across the center of the state. Anchored by the Gateway Transportation Center in St. Louis and Union Station in Kansas City, the route serves eight intermediate stops: Kirkwood, Washington, Hermann, Jefferson City (the state capital), Sedalia, Warrensburg (home to the University of Central Missouri), Lee’s Summit, and Independence.
Rather than operating as an isolated line, the corridor connects directly with Amtrak’s Lincoln Service (to Chicago), as well as the long-distance Southwest Chief and Texas Eagle routes.
Comparing the 2021 and 2026 MoDOT Studies
To evaluate the corridor’s financial footprint, MoDOT utilized the IMPLAN economic modeling system to measure two primary categories of economic activity: visitor and tourism spending generated by passengers, and Amtrak’s direct in-state employment and procurement. Importantly, MoDOT adjusted the 2026 study’s figures for inflation to allow for real-dollar comparisons, and the 2021 study utilized pre-pandemic 2018–2019 ridership and spending data (172,555 annual riders)—meaning the gains between the two reports reflect growth beyond a simple post-COVID travel rebound.
Between the 2021 and 2026 evaluations, the corridor’s metrics shifted as follows:
Total Annual Economic Activity: Increased 133.4%, rising from $208.0 million in the 2021 report to $485.5 million in the 2026 report.
State and Local Tax Revenue: Doubled from just over $22.0 million annually in 2021 to $44.4 million in 2026 (+101.8%).
Total Jobs Supported: Rose 48%, expanding from 1,250 annual jobs (800 from tourism/rider spending and 450 from Amtrak operations/procurement) to 1,850 jobs in 2026.
Annual Labor Income: Grew 52.9%, climbing from $65.0 million to $99.4 million.
Annual State Operational Support: Increased 60%, rising from $10.0 million per year in the 2021 report to $16.0 million per year in the 2026 report.
Metric | 2021 MoDOT Study (2018/19 Data) | 2026 MoDOT Study (2024 Data) | Net Change |
Service Level | 2 Daily Round Trips | 2 Daily Round Trips (1 Through-Train to Chicago) | + Direct Chicago Connection |
State Operating Support | $10.0 Million | $16.0 Million | +60.0% |
Amtrak In-State Procurement | $28.9 Million | $152.2 Million | +426.6% |
Total Jobs Supported | 1,250 Jobs | 1,850 Jobs | +48.0% |
Annual Labor Income | $65.0 Million | $99.4 Million | +52.9% |
Total Economic Activity | $208.0 Million | $485.5 Million | +133.4% |
Annual Tax Revenue | >$22.0 Million | $44.4 Million | +101.8% |
Unpacking the Drivers: Why Did the Impact Double?
A closer look at the underlying MoDOT and Amtrak data shows that the 133% surge in economic output was not driven by a single factor, but rather by a combination of operational integration, steady ridership growth, and major in-state infrastructure contracting.
1. The Supply Chain Multiplier ($152.2 Million in Local Procurement)
One of the largest catalysts behind the 2026 jump lies in capital and vendor spending. In the 2021 report, Amtrak procured $28.9 million in goods and services from Missouri businesses and employed 78 Missouri residents. By fiscal year 2024 the data window used for the 2026 study, Amtrak’s in-state procurement reached $152.2 million across Missouri’s construction, engineering, railroad, landscaping, and technology sectors, while in-state employment grew to 116 residents earning $10.68 million in base wages. When infrastructure upgrades and maintenance contracts are awarded to in-state engineering and construction firms, those capital dollars circulate directly through local supply chains.
2. Single-Seat Through-Service to Chicago
While the corridor maintained two daily round trips across both study periods, the 2026 configuration highlights a critical operational upgrade: one daily round trip now operates as a through-train directly to Chicago via the Lincoln Service corridor. Eliminating the need for passengers to transfer trains in St. Louis connected mid-Missouri communities directly to the Midwest’s primary hub, boosting ridership to nearly 197,000 annual passengers by FY 2025: surpassing pre-pandemic levels.
3. Balancing Higher Subsidies Against Tax Receipts
For fiscal conservatives and state budget committees, the 60% increase in annual state operational support (from $10 million to $16 million) is a vital figure. Reflecting nationwide increases in rail labor, fuel, equipment maintenance, and host-railroad charges, operating passenger rail costs more in 2026 than it did five years ago.
However, when measured against tax revenue returns, the corridor’s fiscal ratio expanded. In 2021, every $1.00 of Missouri operational support corresponded with $20.80 in broader economic activity and $2.20 in state and local tax revenue. In the 2026 study, every $1.00 of the $16 million operating subsidy corresponded with $30.34 in economic activity and $2.78 in tax receipts.
when measured against tax revenue returns, the corridor’s fiscal ratio expanded

The Regional Policy Landscape: The "Kansas Effect"
Beyond Missouri’s borders, the Northern Flyer Alliance report connects the River Runner’s economic data to broader legislative trends across the Midwest, specifically pointing to neighboring Kansas.
Under Kansas Statute 75-5089, Kansas established a dedicated Passenger Rail Service Revolving Fund, giving the Kansas Department of Transportation (KDOT) a statutory vehicle to manage state rail investments. In the 2025–2026 legislative session, Kansas lawmakers introduced Senate Bill 357 to establish an intercity passenger rail service program with annual transfers into the revolving fund, alongside efforts to maintain "no limit" budgetary flexibility within KDOT.
According to regional advocates, placing passenger rail directly inside a state DOT’s regular budget without arbitrary spending caps allows transportation secretaries to rapidly match Federal Railroad Administration grants. This statutory model has spurred bipartisan legislative rail caucus activity in neighboring states, including Missouri, Wisconsin, and Texas, as states position themselves for federal Corridor ID funding (including MoDOT's ongoing study to extend the River Runner north from Kansas City to St. Joseph).
What the Data Means for Ohio
As Ohio evaluates its own proposed corridors, such as the 3C&D corridor linking Cincinnati, Dayton, Columbus, and Cleveland, or connections through Toledo toward Detroit and Chicago, the five-year trajectory of the Missouri River Runner offers three grounded takeaways:
Corridors Mature Through Network Integration: A two-train-per-day intrastate corridor generates baseline economic value, but linking that corridor into a regional hub like Chicago amplifies both ridership and per-dollar return on investment.
In-State Contracting Drives Economic Multipliers: Financial return from passenger rail comes not just from ticket sales or tourist hotel stays, but from construction, engineering, and maintenance procurement with in-state contractors.
Predictable Funding Structures Matter: Operating costs inevitably rise over time as seen in Missouri’s shift from $10 million to $16 million in annual support. States that pair corridor development with dedicated, flexible DOT revolving funds are better positioned to absorb cost escalations while capturing federal matching dollars that multiply across local economies.
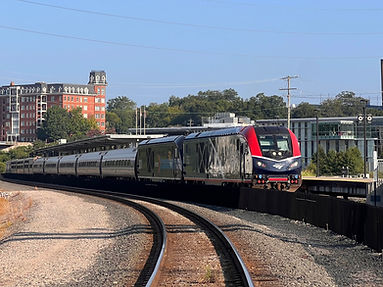
Cover photo by OHFalcon72


ABOUT ALL ABOARD OHIO
All Aboard Ohio is a non-profit, member-based organization dedicated to promoting improved public transportation and passenger rail service throughout the state.
Founded in 1973 and incorporated as a registered 501c-3 in 1987, All Aboard Ohio has spent more than 50 years advocating, educating, and working towards our goal of a connected Midwest
All Aboard Ohio is a 501c-3 nonprofit with over 50 years of advocacy work, advocating for improved public transportation and passenger rail service in the Midwest
©2025 by All Aboard Ohio
Get in Touch
3136 Kingsdale Center,
#112 Columbus, OH 43221
Federal Tax ID: 31-1066182


